Replication latency is one of the key indicators of good replication.
When I started working on OpenLogReplicator one of my key tasks was to keep the latency as low as possible. What does that mean?
When a client commits a transaction and the database confirms that the transaction is committed – it means that the client can be sure that even if the database breaks the transaction is saved.
Internally the database uses many optimization techniques to speed the process – for example it may be grouping transactions from many clients and write them together – to reduce the delay of confirming them their transactions.
When OpenLogReplicator reads the transaction log – even it it would see a COMMIT Op Code (5.4) in the redo log it can not be absolutely sure that it has already read all the peaces of the whole transaction. Oracle database can change the order of the transaction chunks in the redo log and they might appear in not strict order on disk.
Let’s try to measure how low can be the latency – between the actual commit of the transaction and the moment that it would be read by OpenLogReplicator and sent to Kafka (the time of logging to the Kafka queue).
But before you look at results I want to make a disclaimer:
- The test have been run on home PC lab – not very fancy – your results can vary
- I have not made any special optimizations – just used default parameters for the database and OpenLogReplicator
- What I am actually measuring is the latency between the INSERT operation and commit to Kafka (not the time of the COMMIT in the database)
The test is very simple:
- Database box – Intel i5 with SSD drive running Linux64 and Oracle 19c database
- 1G LAN
- Kafka box – Intel i7 with SSD drive running Linux64, OpenLogReplicator and Kafka
I have run Kafka on Docker and mounted database disk (containing redo logs) using sshfs (wiht no compression aes128-ctr cipher) and so that OpenLogReplicator box could read database redo logs.
The test is just a simple:
create table usr1.adam1(a numeric, b number(10), c number(10, 2), d char(10), e varchar2(10), f timestamp(9), g date);
alter table usr1.adam1 add constraint adam1_pk primary key(a);
And filled with single-row transactions:
declare
    tmstp timestamp(9);
begin
    select current_timestamp into tmstp from dual;
	for i in 1 .. 1000000 loop
		insert into usr1.adam1 values(i, 0010, 10.22, '010', '010', tmstp, null);
		commit;
		select current_timestamp into tmstp from dual;
	end loop;
end;
/
The SQL file generates 1M to be inserted and on my test box takes about 1m54s to complete. It generates 1.143G of redo logs which roughly gives 10MB/s redo generation. Just single thread, not much.
I have measured the actual speed of processing redo logs on my laptop and OpenLogReplicator can process redo logs in about 32s which gives speed about 35MB/s. This is just my laptop and home lab with Kafka running on the same box, so don’t expect great results. Please have in mind that the result of run 32s comes from a second run – when the test was completed – and reading all transactions from archived redo logs.
But what would be the latency?
To measure the latency I am using the timestamp for the record measured just after running the COMMIT command. There is no other good way of measuring when exactly COMMIT has finished.
It looks like that for a typical workload the replication latency is about 11,7ms, but when the database increase checkpoint blocks – spikes appear. This is something I can’t care anything about.
More performance tests to come.
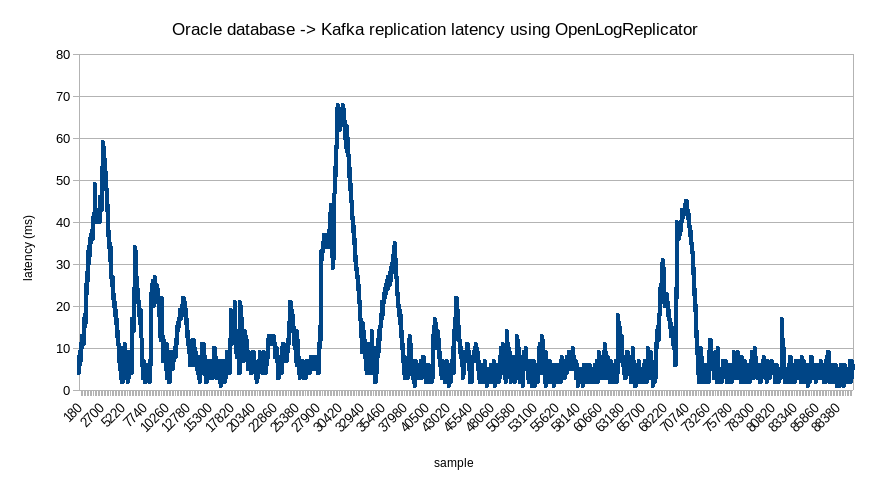
This is an updated version of the graph. The previous test result was considered spoiled since it did not measure transaction latency but commit latency of the database itself.